ดาวน์โหลดและติดตั้งโปรแกรม Tableau
มีให้เลือกใช้งาน 2 versions
Tableau Public ใช้งานฟรี ไม่มีวันหมดอายุ
https://public.tableau.com/en-us/s/
Tableau Desktop สำหรับ Trial Version ใช้งานได้ 14 วัน หรือซื้อ License สำหรับบริษัท
https://www.tableau.com/
Tableau Desktop for Education สำหรับนักเรียน นักศึกษา หรือ ครู อาจารย์ ใช้งานฟรีได้ 1 ปี และต่ออายุได้ใหม่ในปีถัดไป
สมัครใช้งานฟรีสำหรับ
Tableau for Students ทาง https://www.tableau.com/academic/students
Tableau for Teaching ทาง https://www.tableau.com/academic/teaching
ดาวน์โหลด Dataset ที่ใช้ในการเรียน
ชุดข้อมูล Global Superstore Orders ทาง https://bit.ly/tableau_datastores
เรียนการใช้งานโปรแกรม Tableau เพื่อวิเคราะห์ข้อมูลร้านค้าแบบใช้งานได้จริง
Net Profit Margin = Profit/Sales
คือ อัตราส่วนที่บอกถึงความสามารถในการทำกำไรของบริษัท
Net Profit Margin มีค่าสูงแสดงว่าสินค้าหรือบริการของบริษัท มีความสามารใจการทำกำไรได้ดี ซึ่งอาจเกิดจากการบริหารจัดการต้นทุนของสินค้าได้ดี
Net Profit Margin มีค่าต่ำแสดงว่าสินค้าและบริการของบูริษัทนั้นมีความสามารถในการทำกำไรที่ต่ำ เกิดจากบริหารจัดการต้นทุนของสินค้าที่ไม่มีประสิทธิภาพเท่านี้
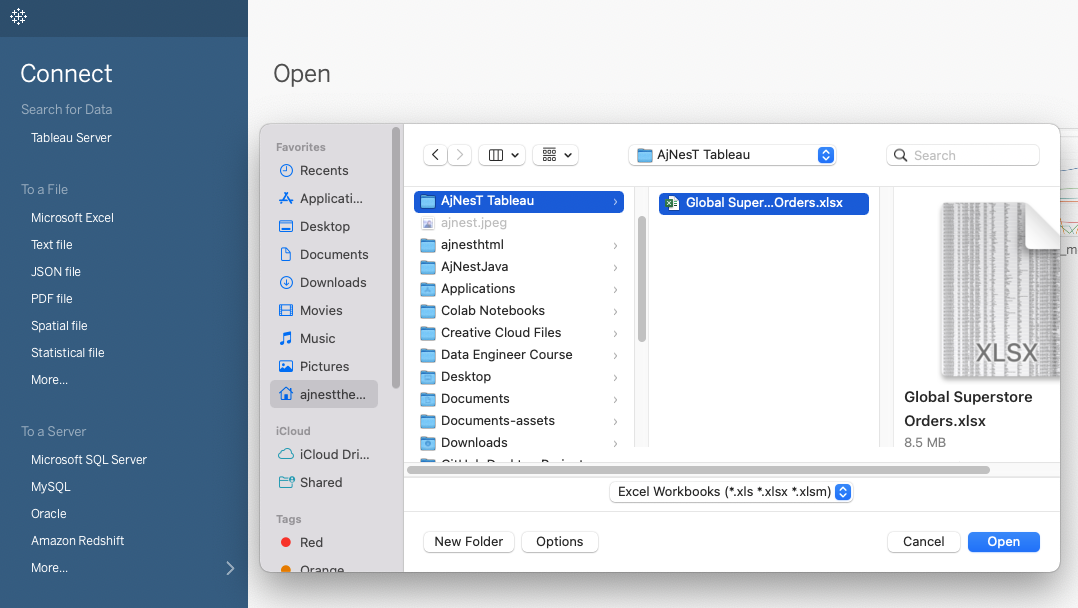
1. เปิดโปรแกรม Tableau –> Microsoft Excel –> เลือกไฟล์ข้อมูล Global Superstore Orders.xlsx –> Open
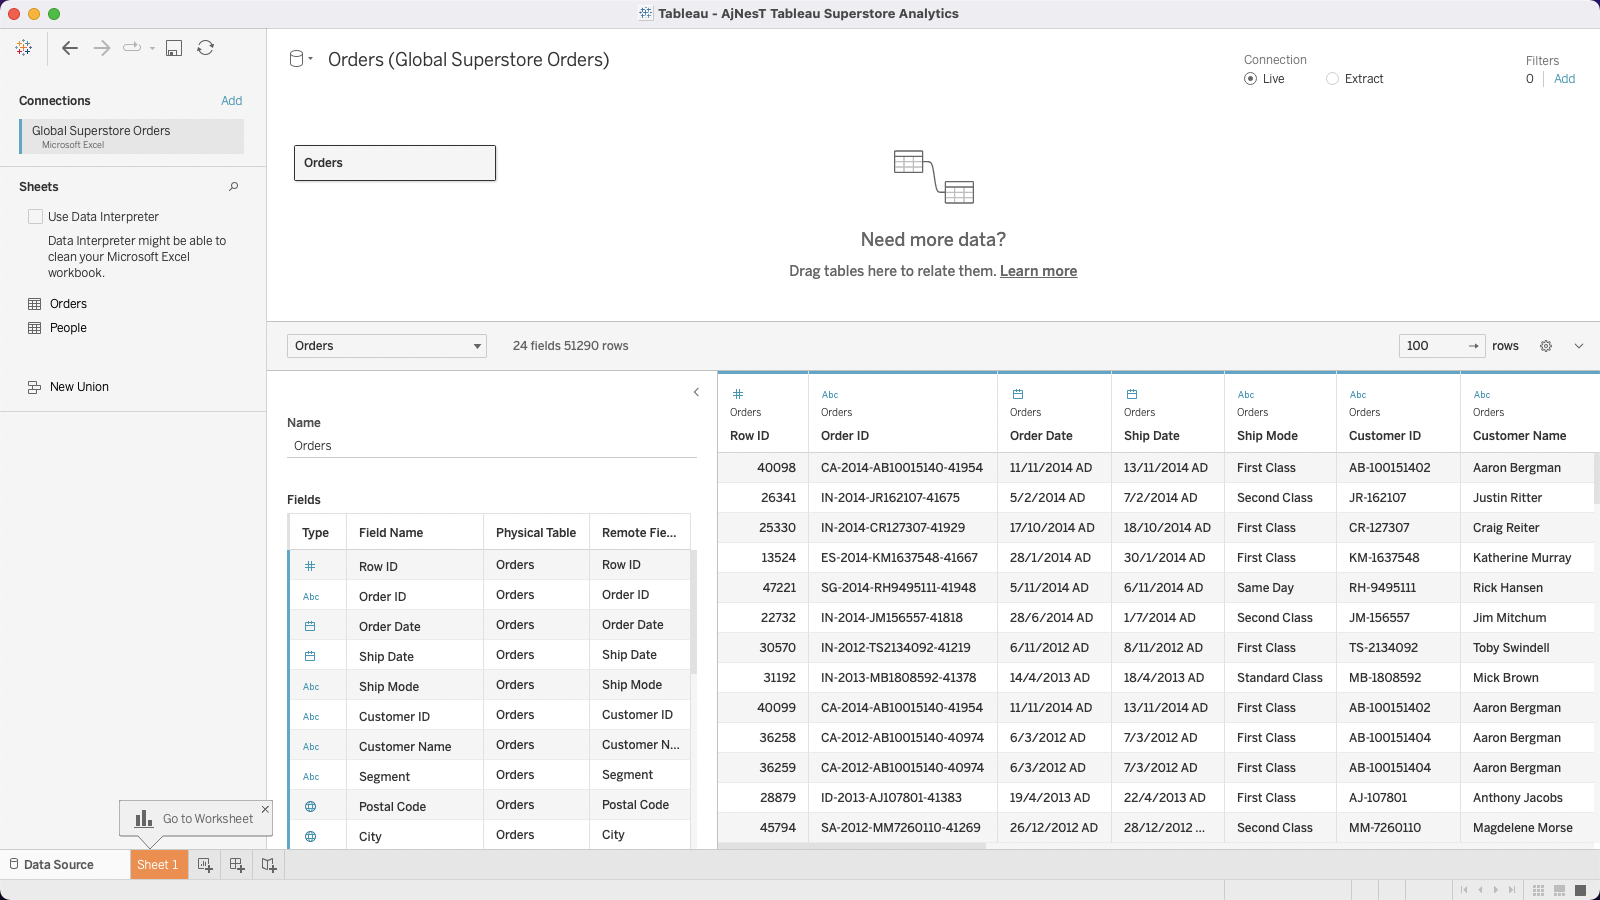
2. ลาก Sheet ชื่อ Orders เข้าไปใส่ในพื้นที่ว่าง จะแสดงข้อมูลทั้งหมดของ Dataset 24 Fields 51290 Rows เป็นข้อมูลของร้านค้า Superstores
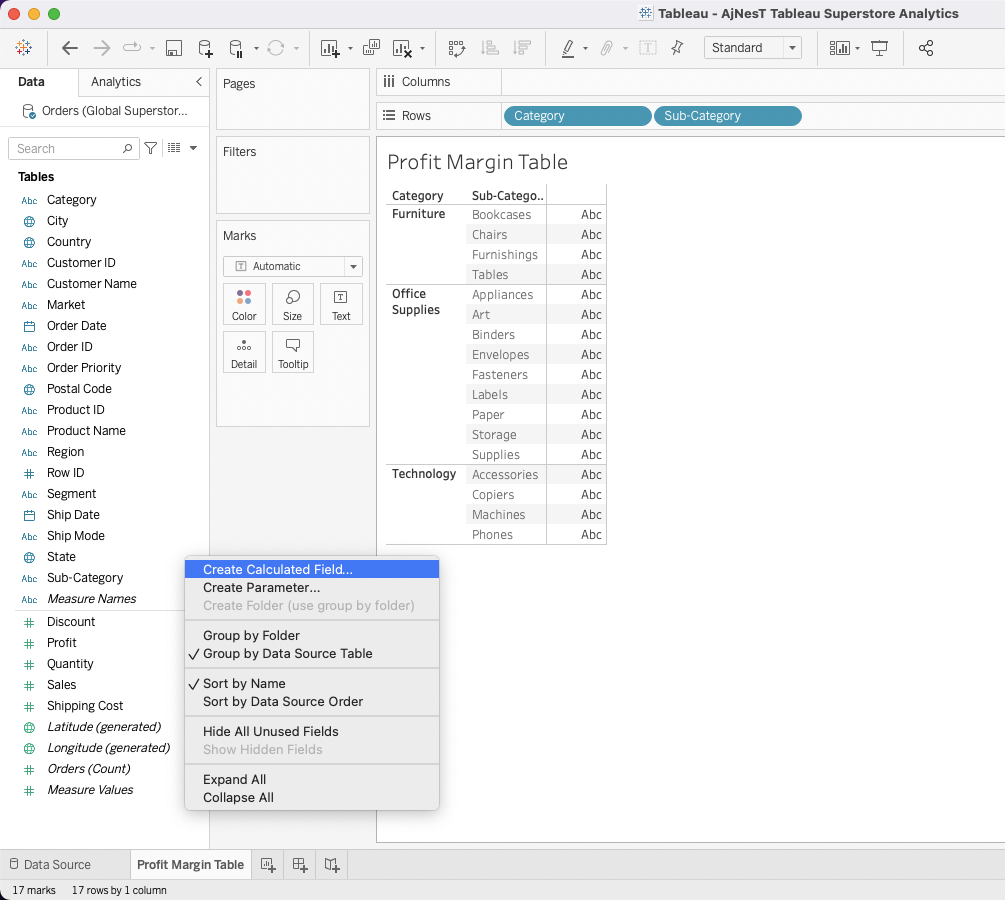
3. เลือกที่ Go to Worksheet: Sheet 1 กด Right Click –> Rename ชื่อเป็น Profit Margin Table
4. ลาก Category และ Sub-Category ไปไว้ที่ Rows ดังภาพ
5. Right Click บริเวณพื้นที่ว่างใต้ Measure Values –> เลือก Create Calculated Field เพื่อสร้างสูตรคำนวณ Profit Margin
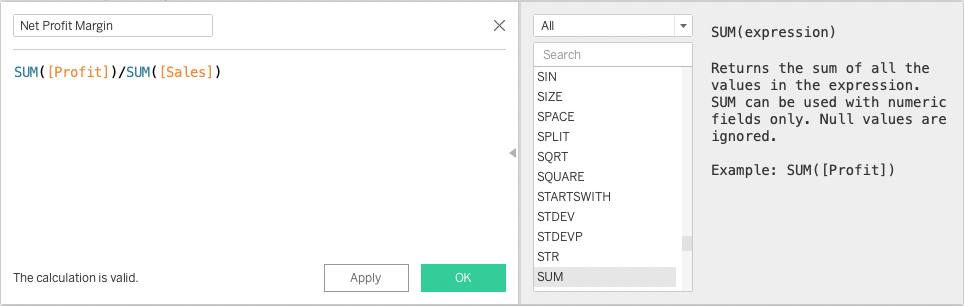
6. สร้างสูตร Net Profit Margin –> ตั้งชื่อ Net Profit Margin –> SUM([Profit])/SUM([Sales]) –> OK
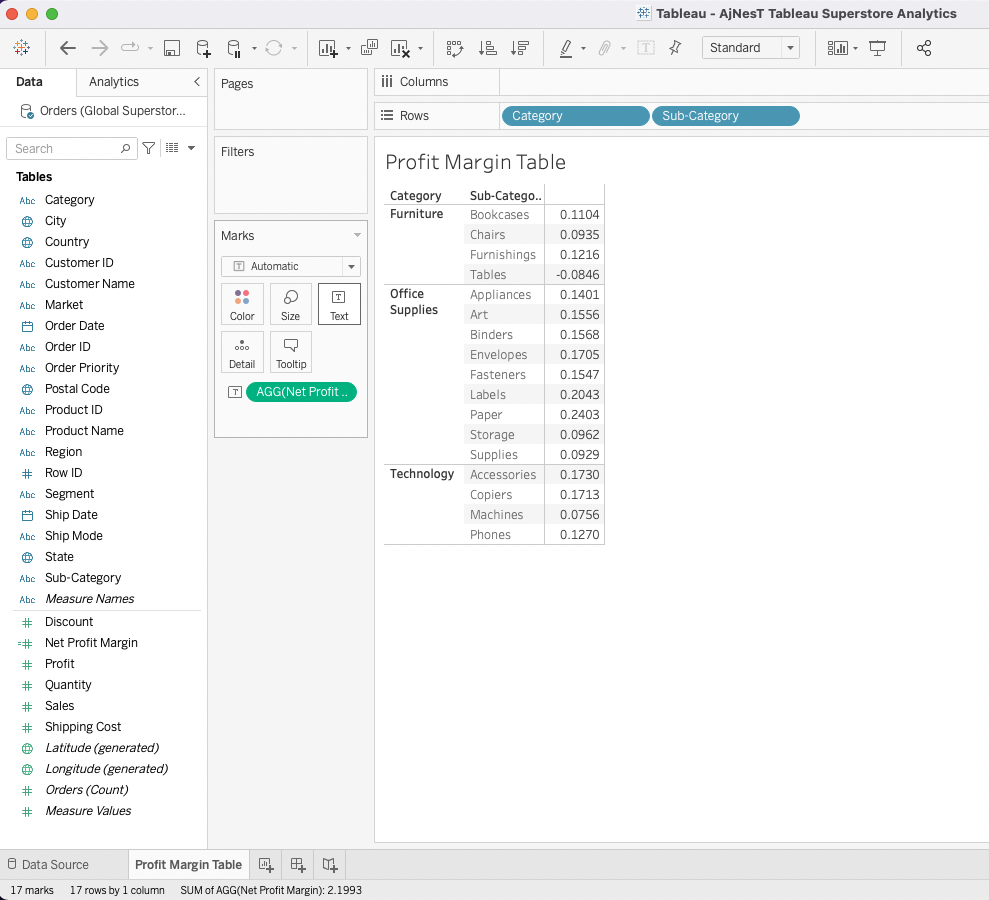
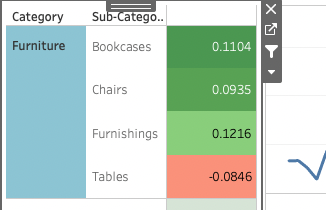
7. ลาก Net Profit Margin ไปใส่ที่ Marks –> Text –> จะแสดง Net Profit Margin ในตารางของแต่ละ Category
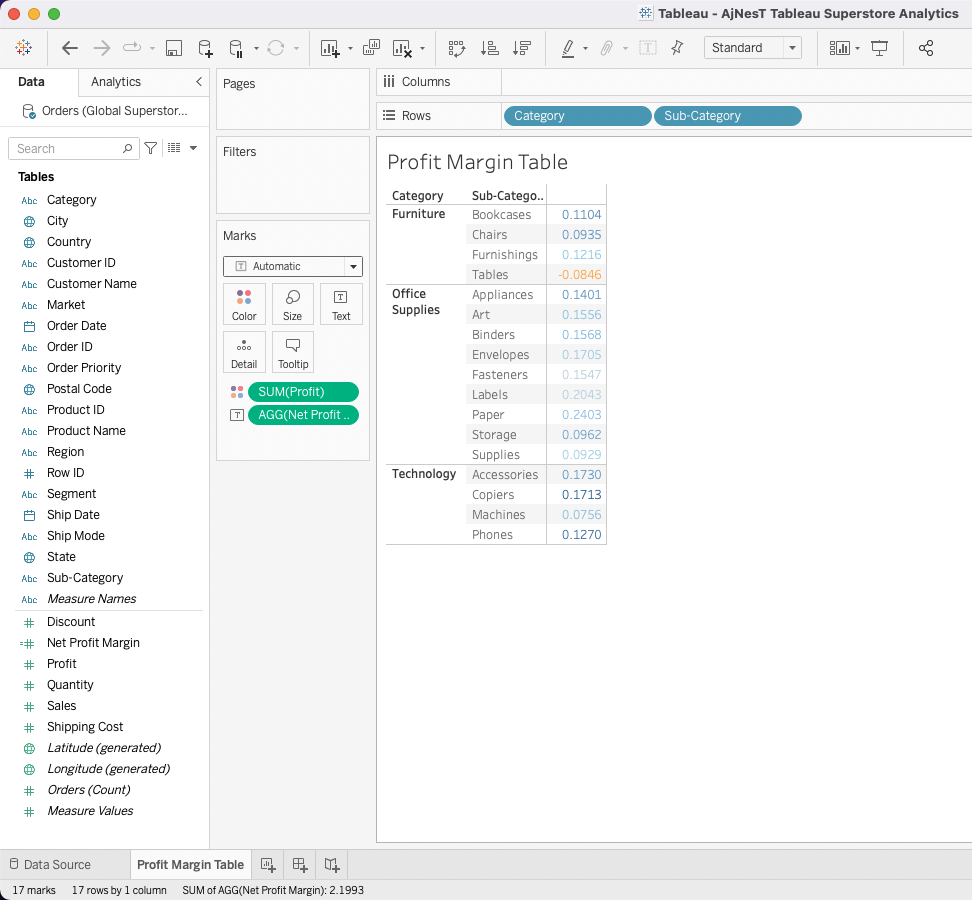
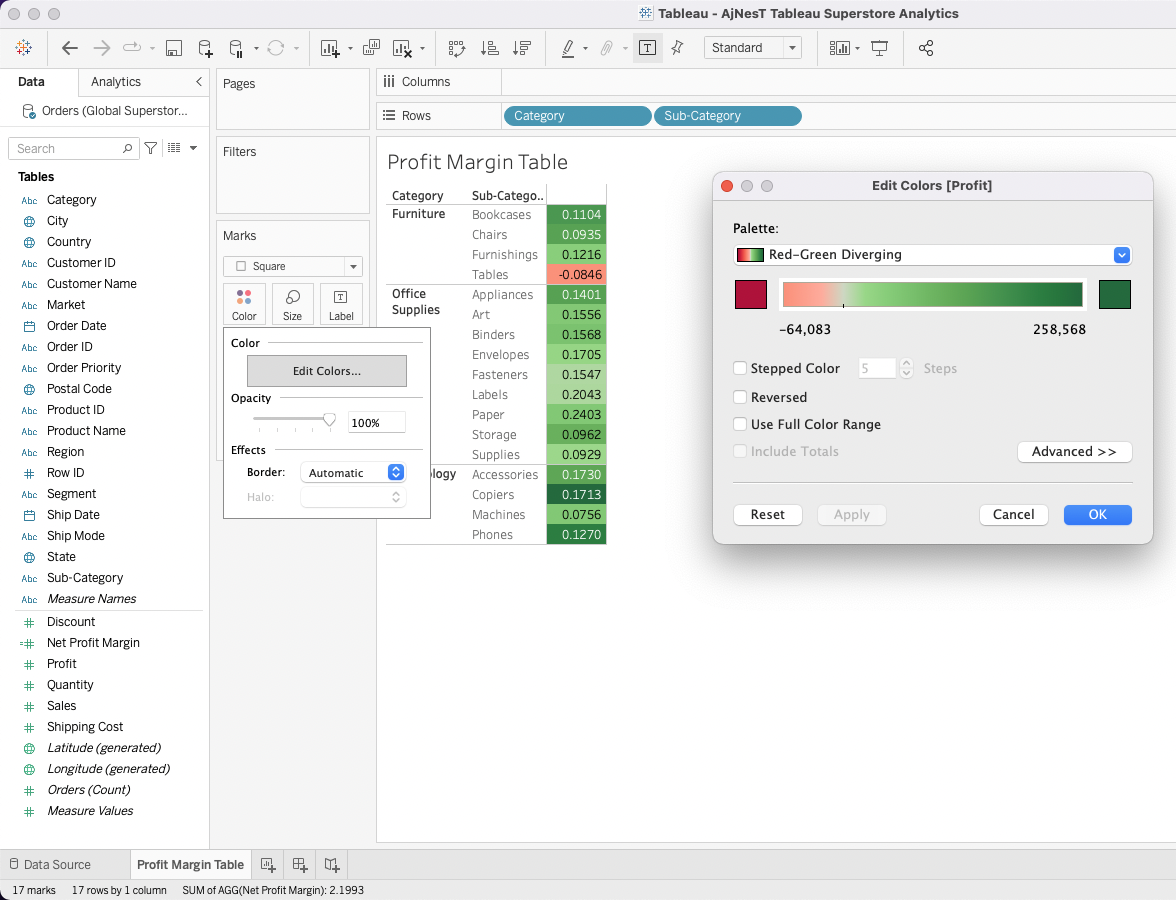
8. ลาก Net Profit Margin ไปใส่ที่ Marks –> Color –> ตัวเลขของ Net Profit Margin จะเปลี่ยนเป็นสี
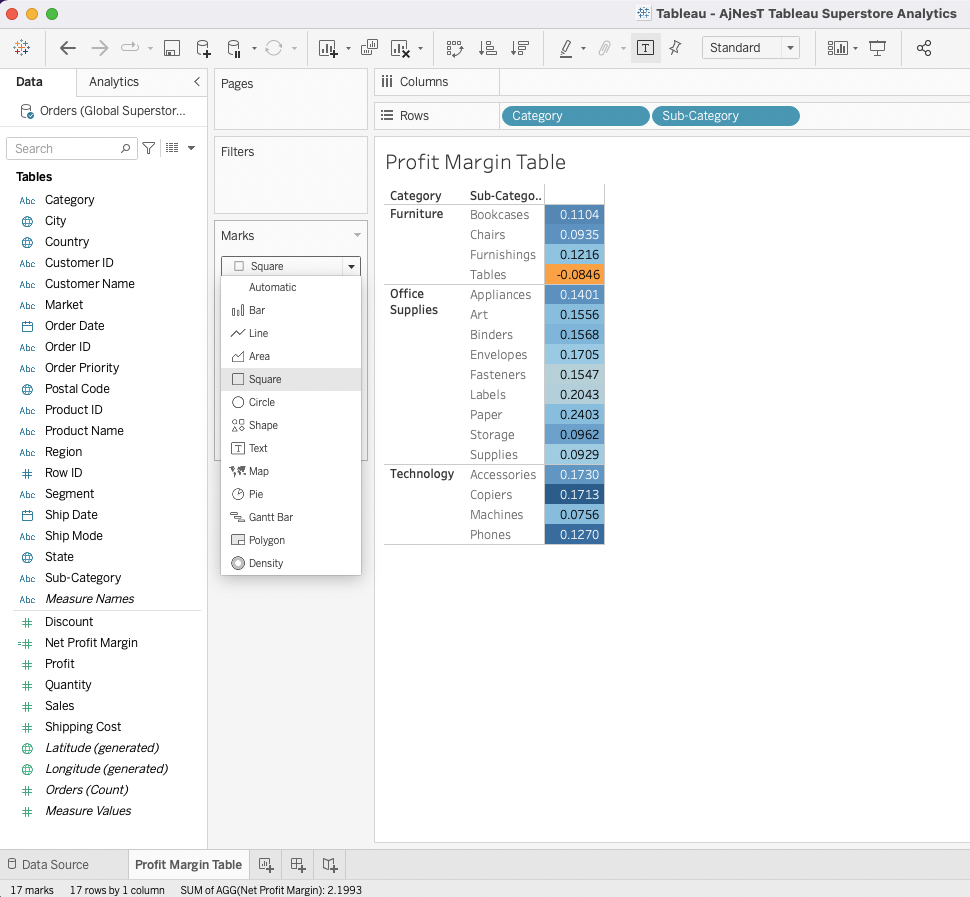
9. ปรับตรง Marks –> Automation เป็น Square –> จะแสดงค่า Net Profit Margin เป็นแถบสี
10. เลือก Color –> Edit Colors… –> เลือกชุดแถบสีที่ต้องการ –> OK

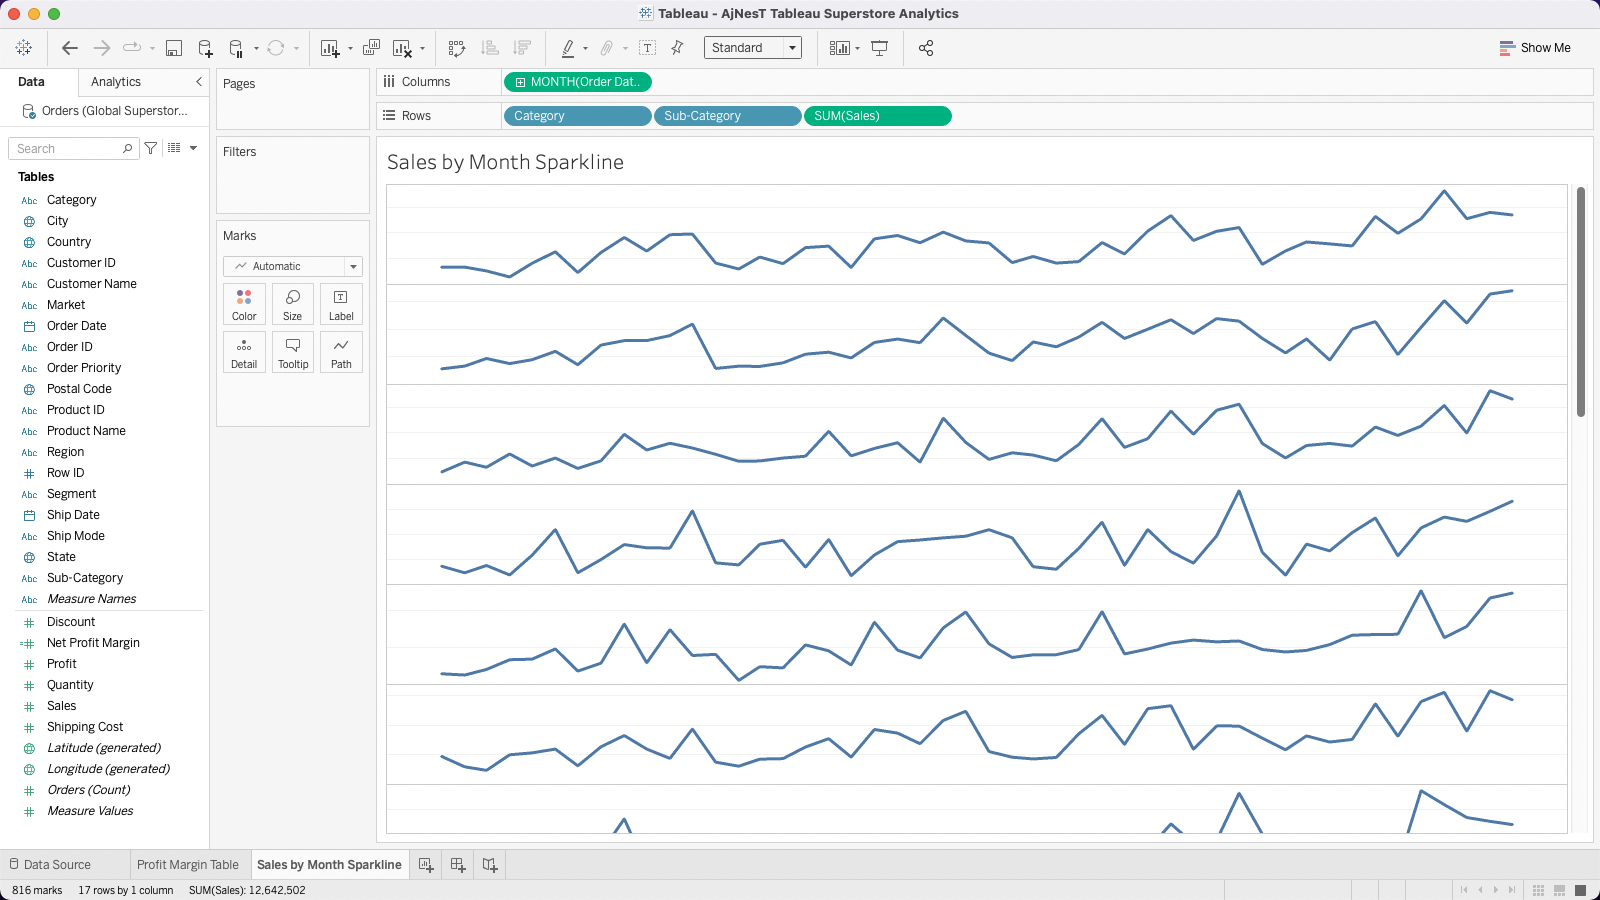
11. New Worksheet –> Rename ชื่อ Sales by Month Sparkline
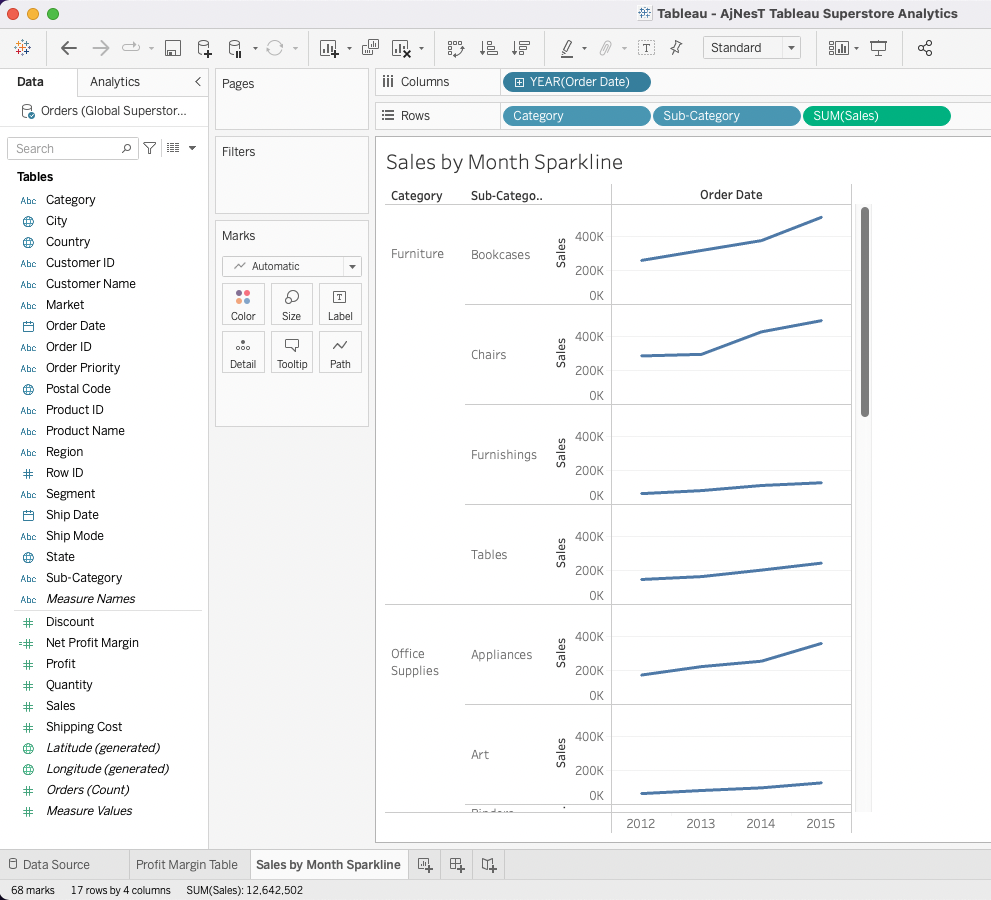
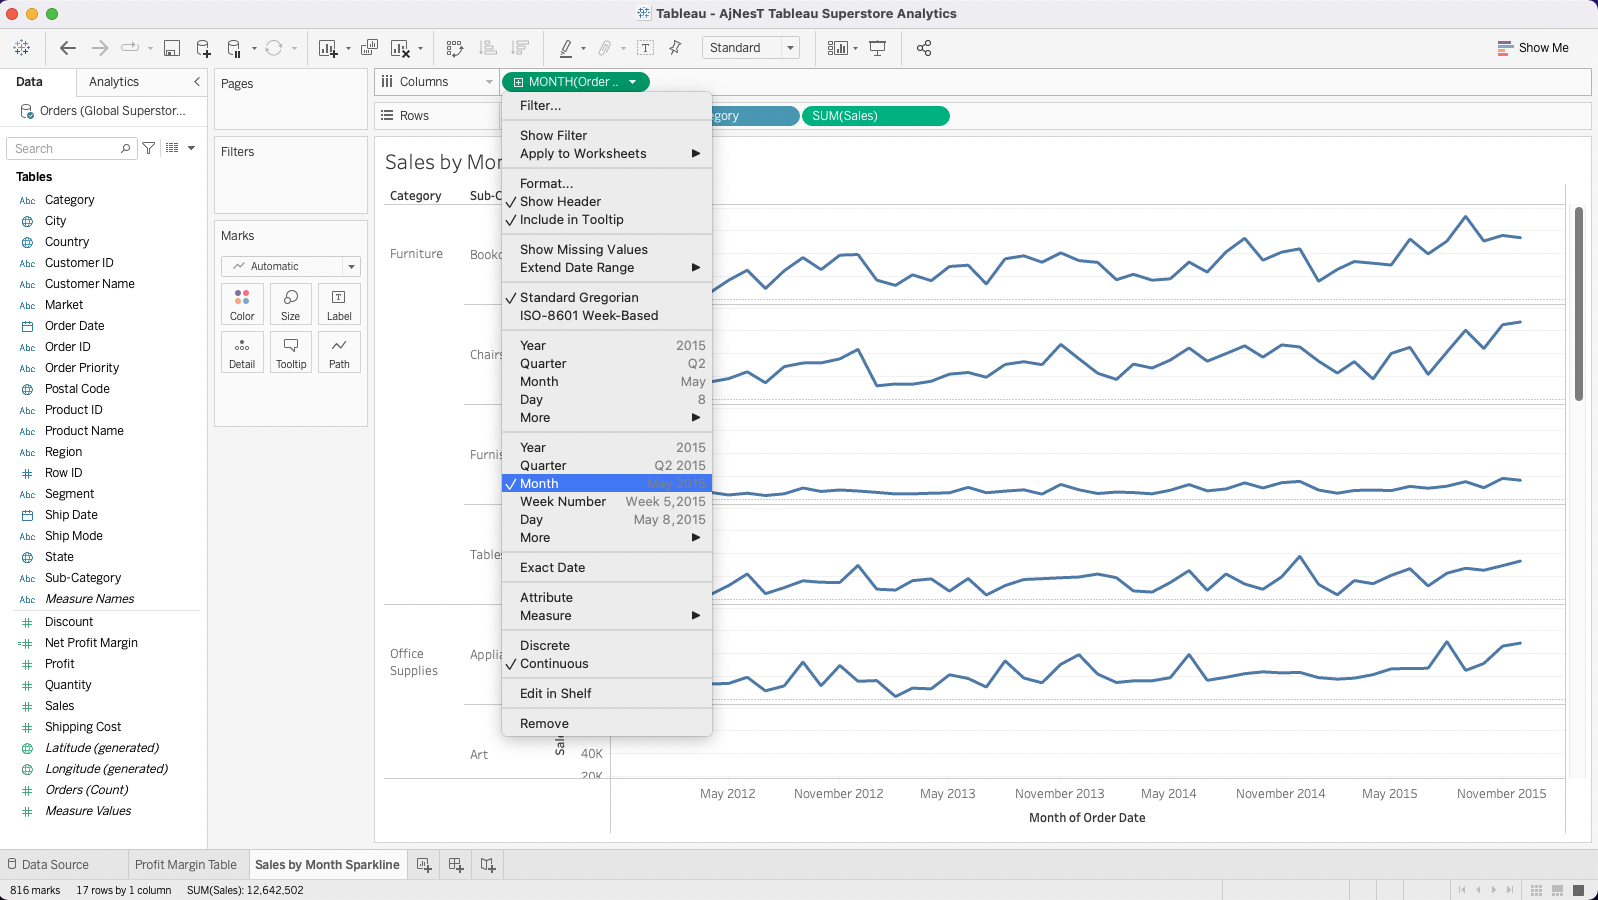
12. เลือก YEAR(Order Dates) –> Month ดังภาพ
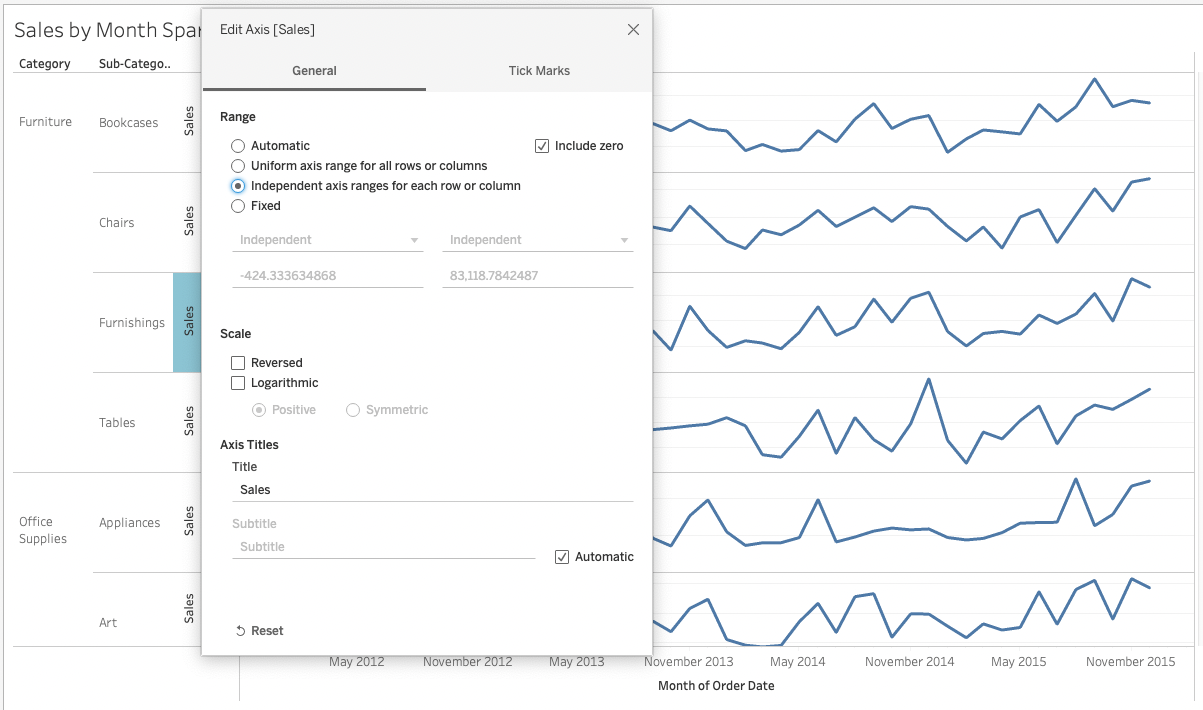
13. ไปที่ Sales –> Right Click –> Edit Axis
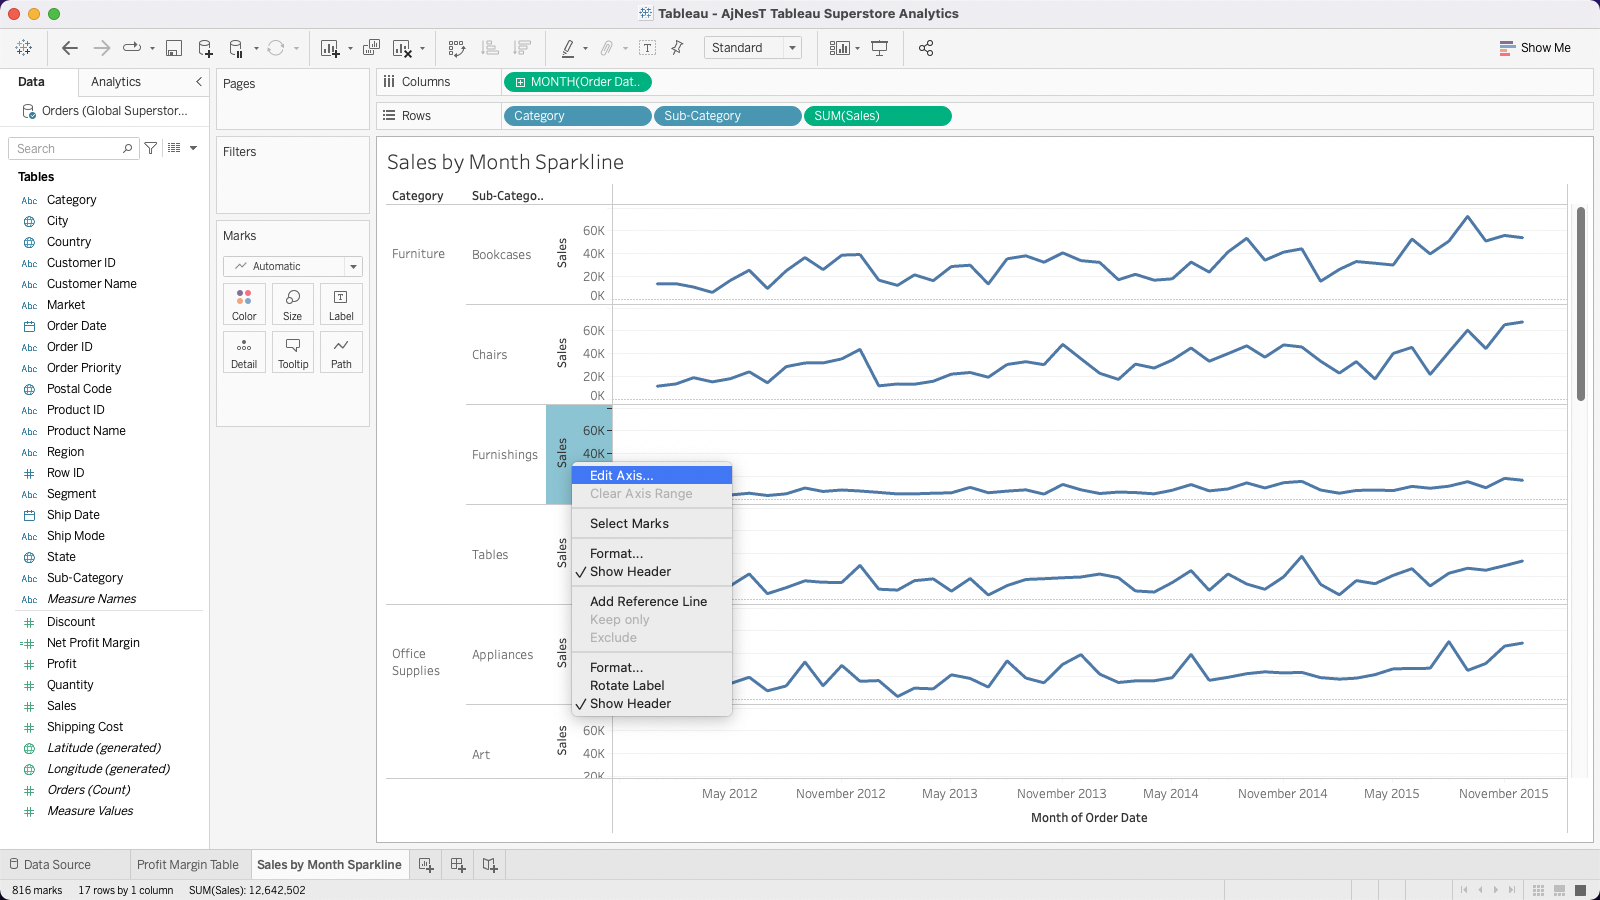
14. เลือก Independent axis ranges for each row or column เพื่อให้แกน x, y เป็นอิสระเวลามองแนวโน้วจะได้เข้าใจได้เร็วขึ้น
15. Right Click ที่แกนต่าง ๆ ให้เลือก Hide หรือติ๊ก Show Header ให้ครบทุกส่วน
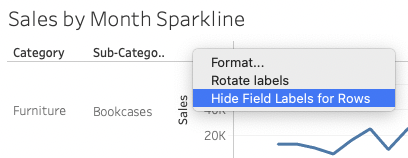
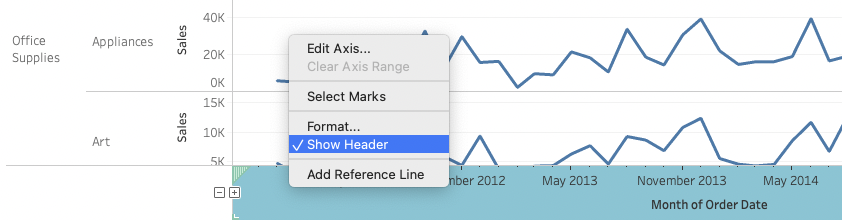
16. เหลือเฉพาะ Sales by Month Sparkline
17. New Worksheet –> Rename ชื่อ Sales by Month Bar Chart
18. ลาก Order Date ไปใส่ที่ Columns โดยปรับเป็น MONTH(Order Dates) และลาก Sales ไปใส่ที่ Rows
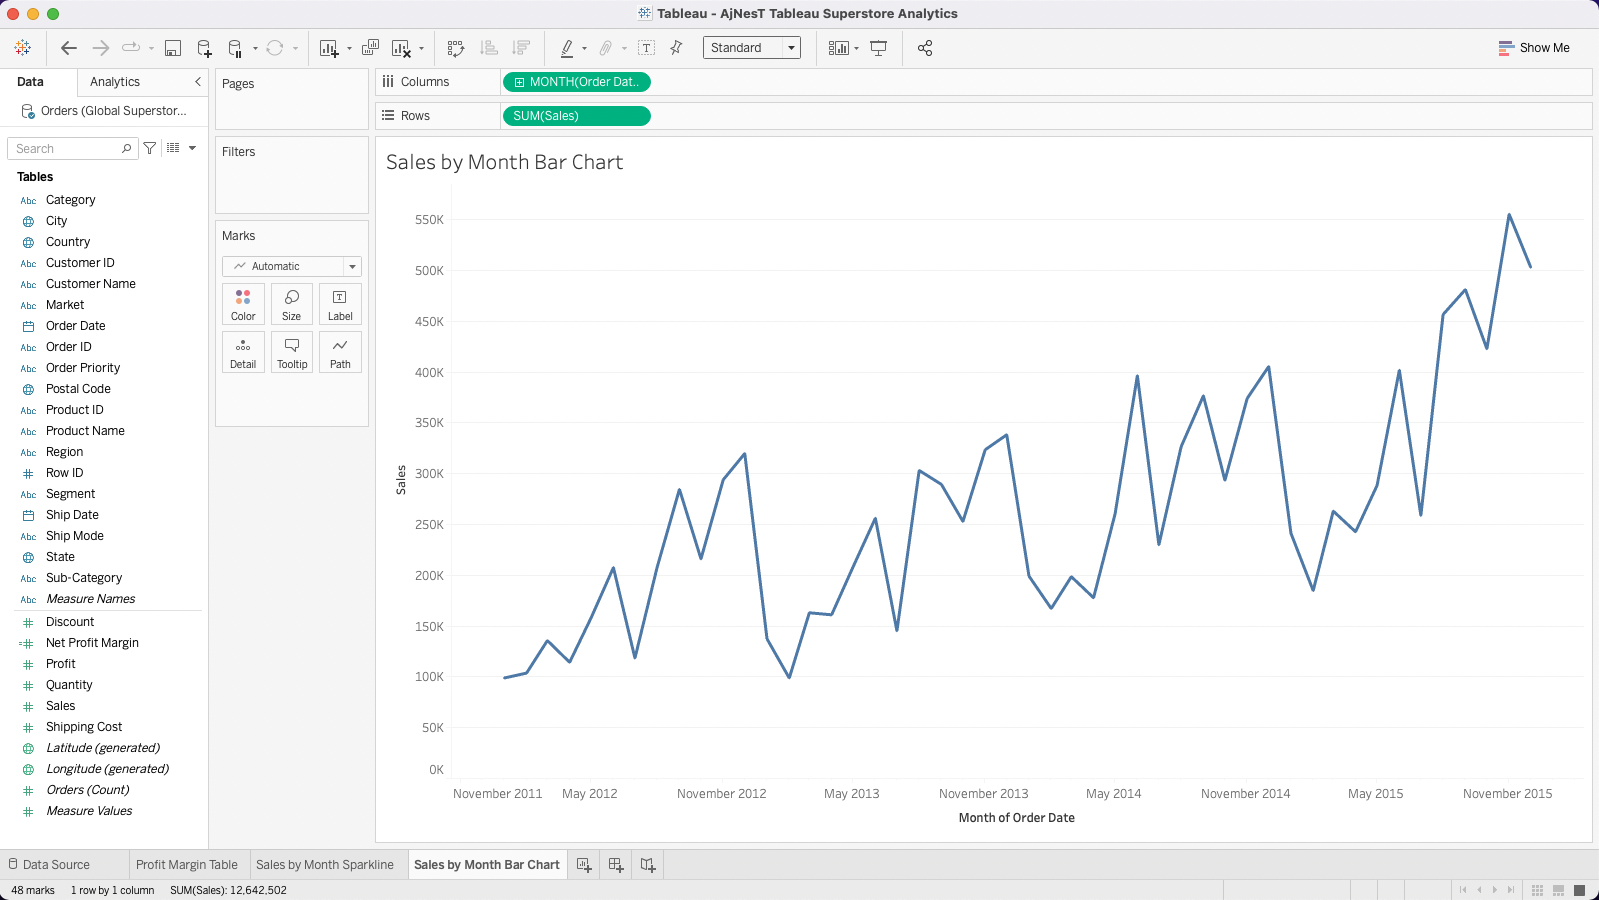
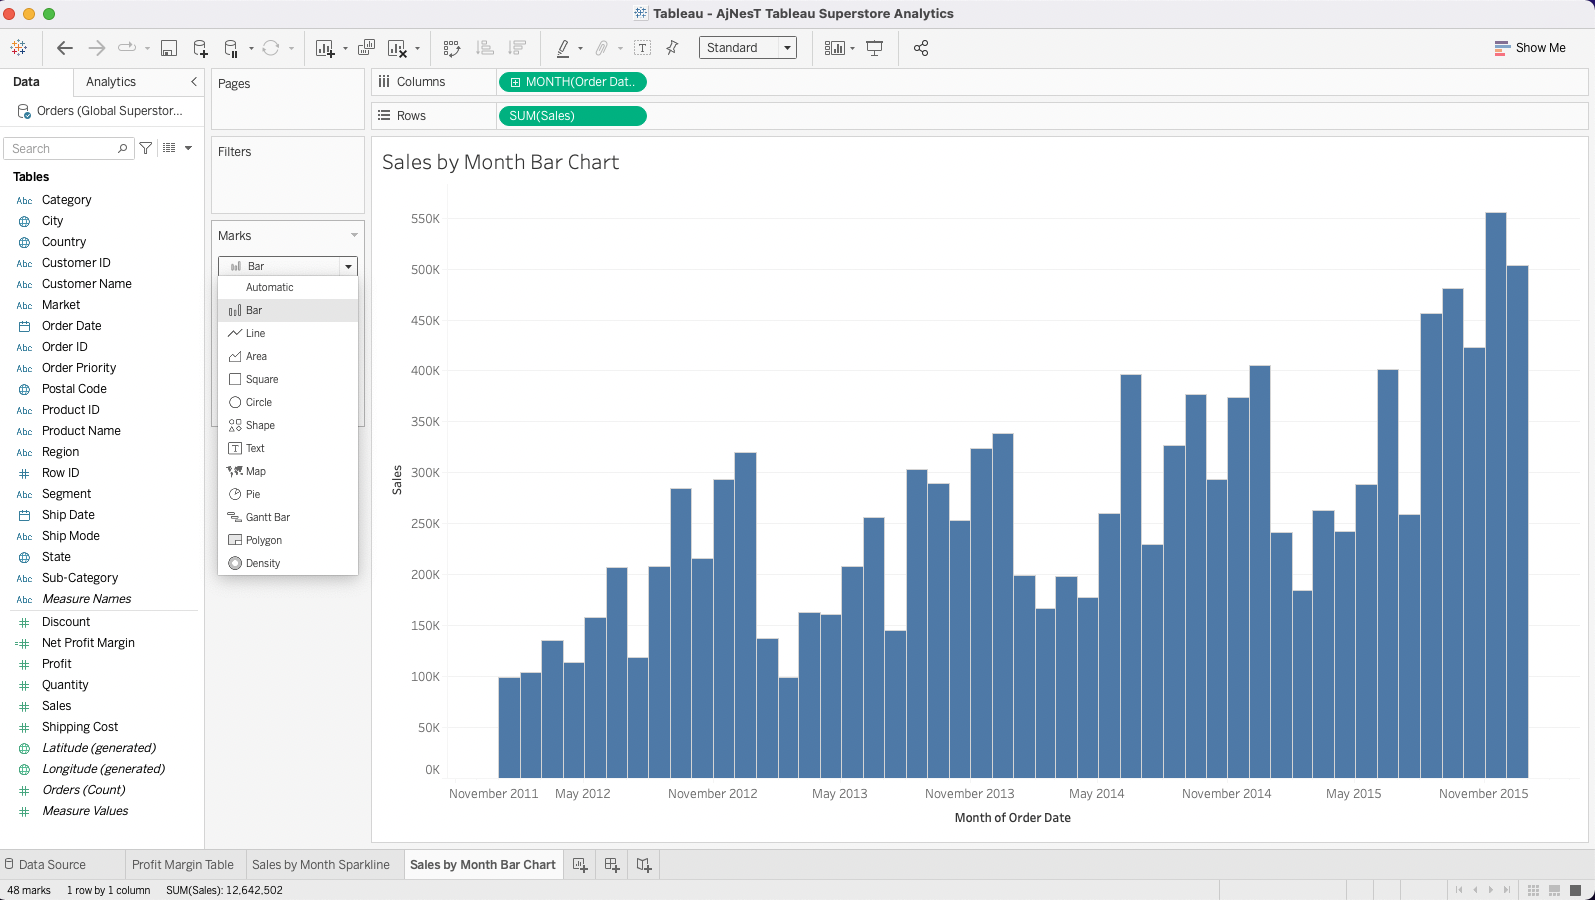
19 . ที่ Marks ปรับ Automatics –> Bar
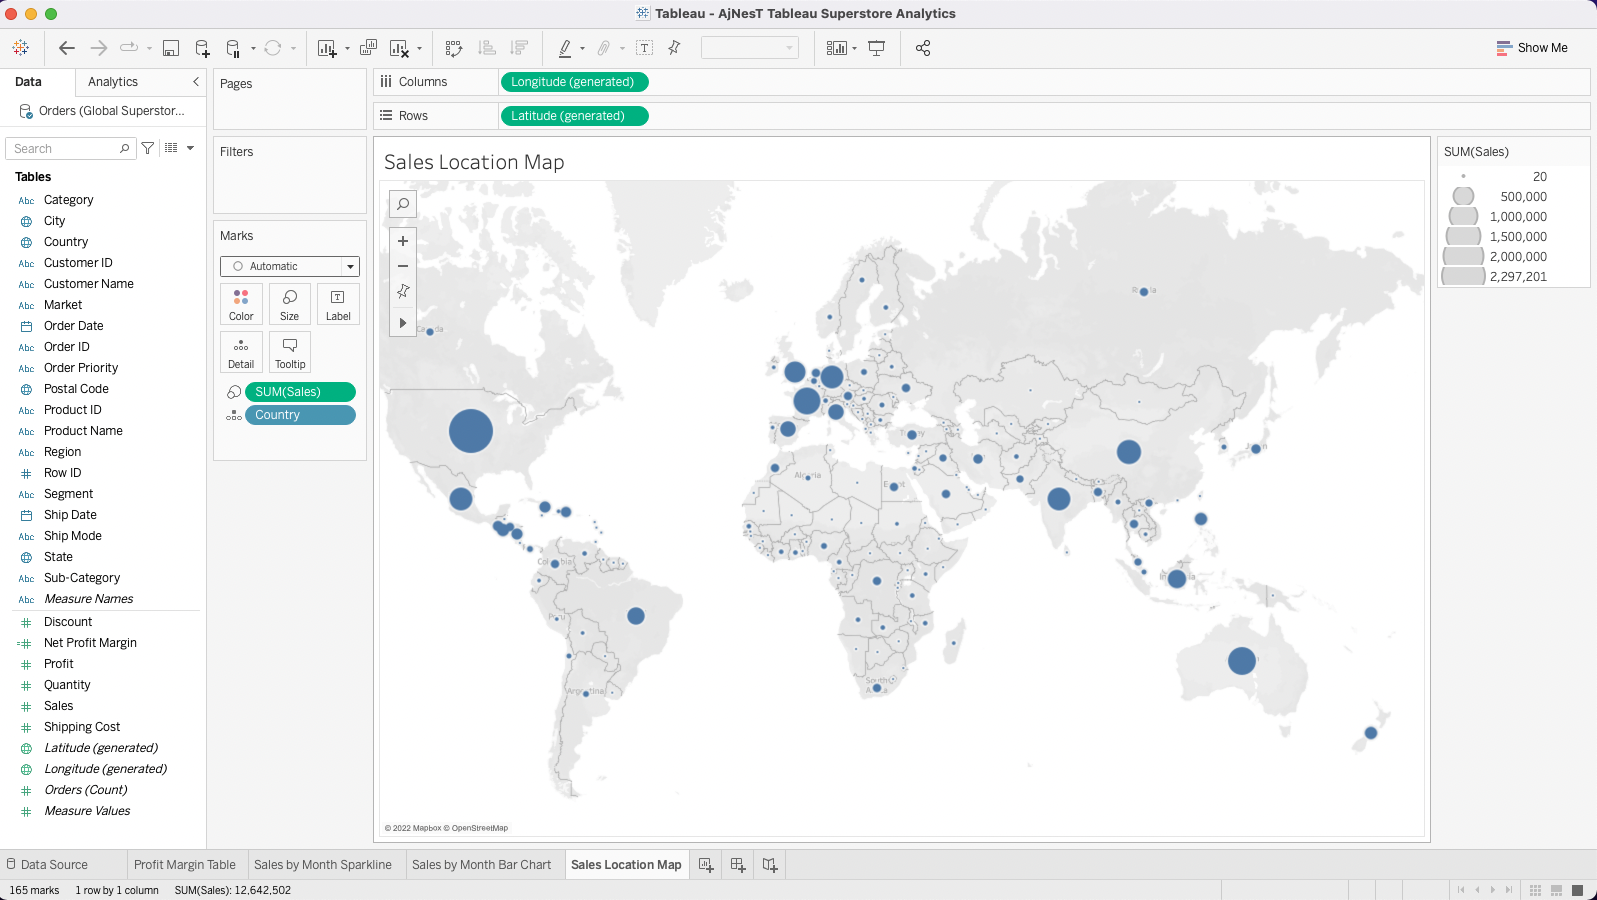
20. New Worksheet –> Rename ชื่อ Sales Location Map
21. ลาก City ไปใส่ในพื้นที่ว่าง
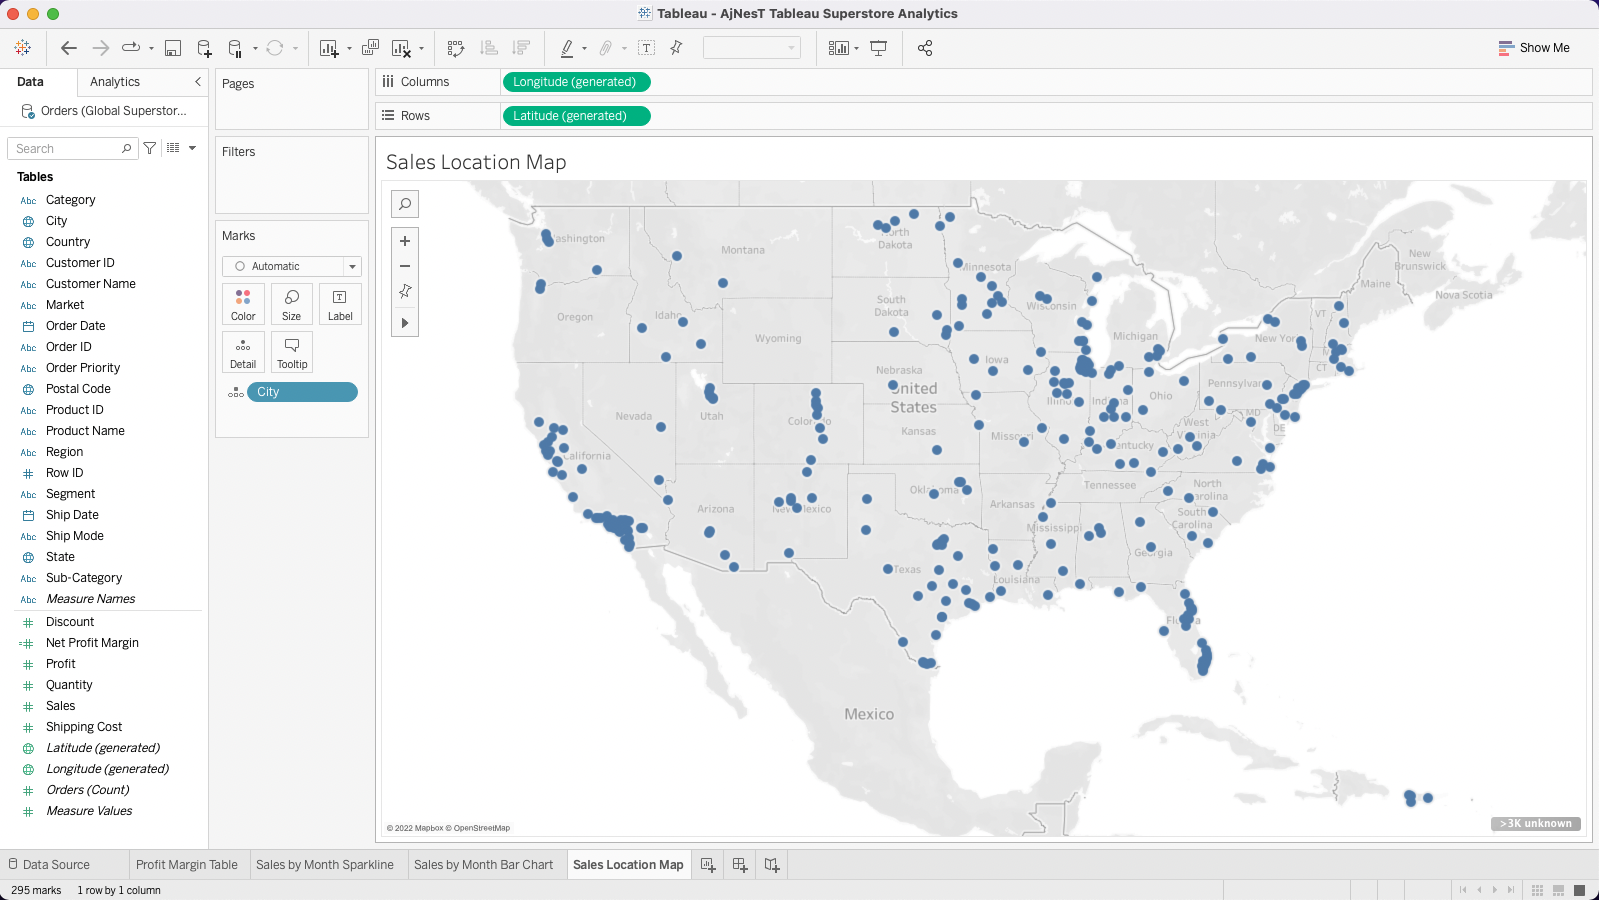
22. เลือก >3K unknown –> Edit Locations…
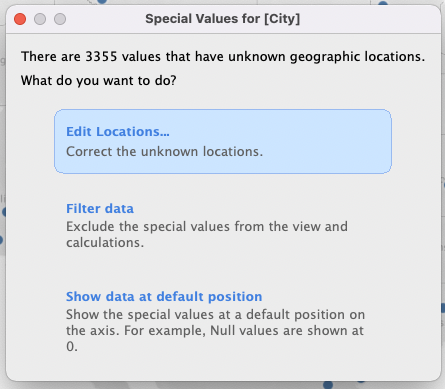
23. เลือก From field: Country เพื่อให้แสดงประเทศต่าง ๆ –> OK
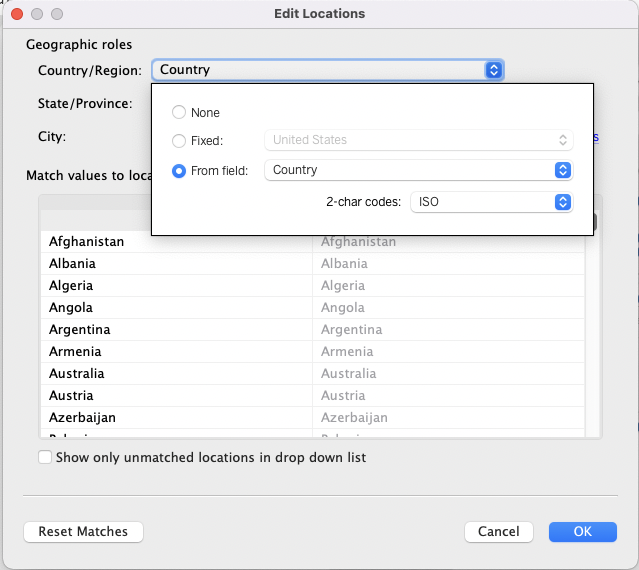
24. แสดผลข้อมูลบนแผนที่
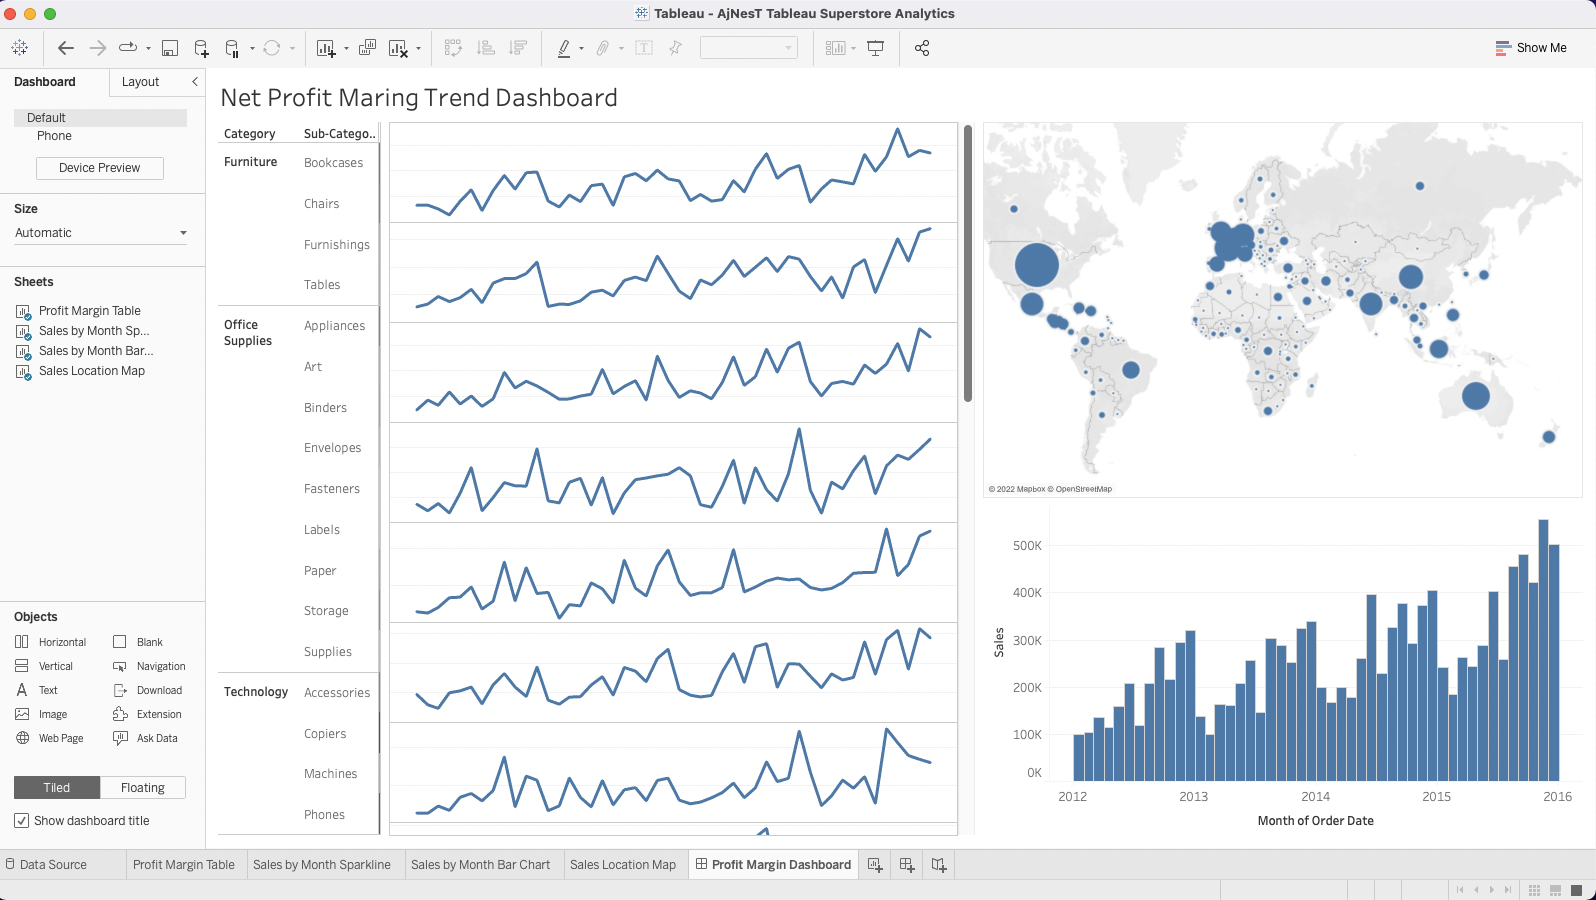
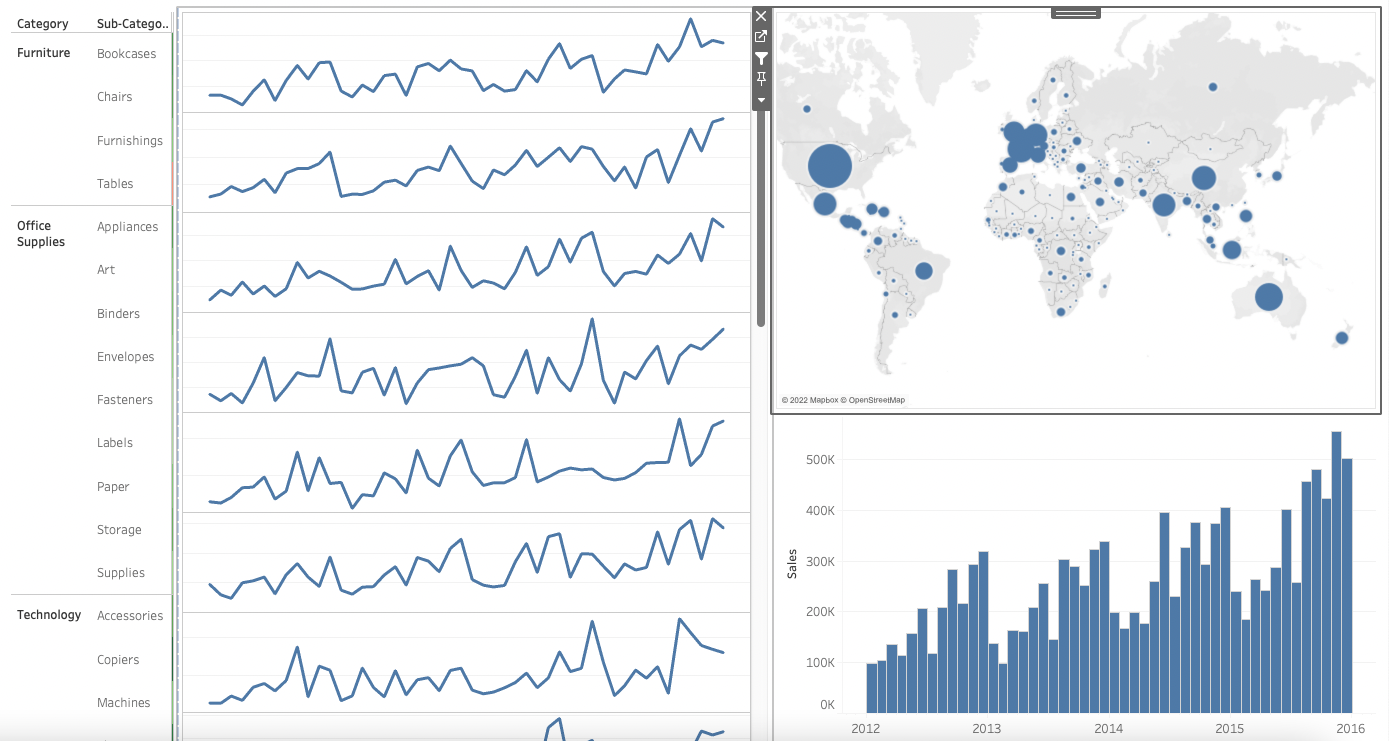
25. New Dashboard –> Rename ชื่อ Profit Margin Dashboard –> จัดหน้าให้เป็นแบบในรูป
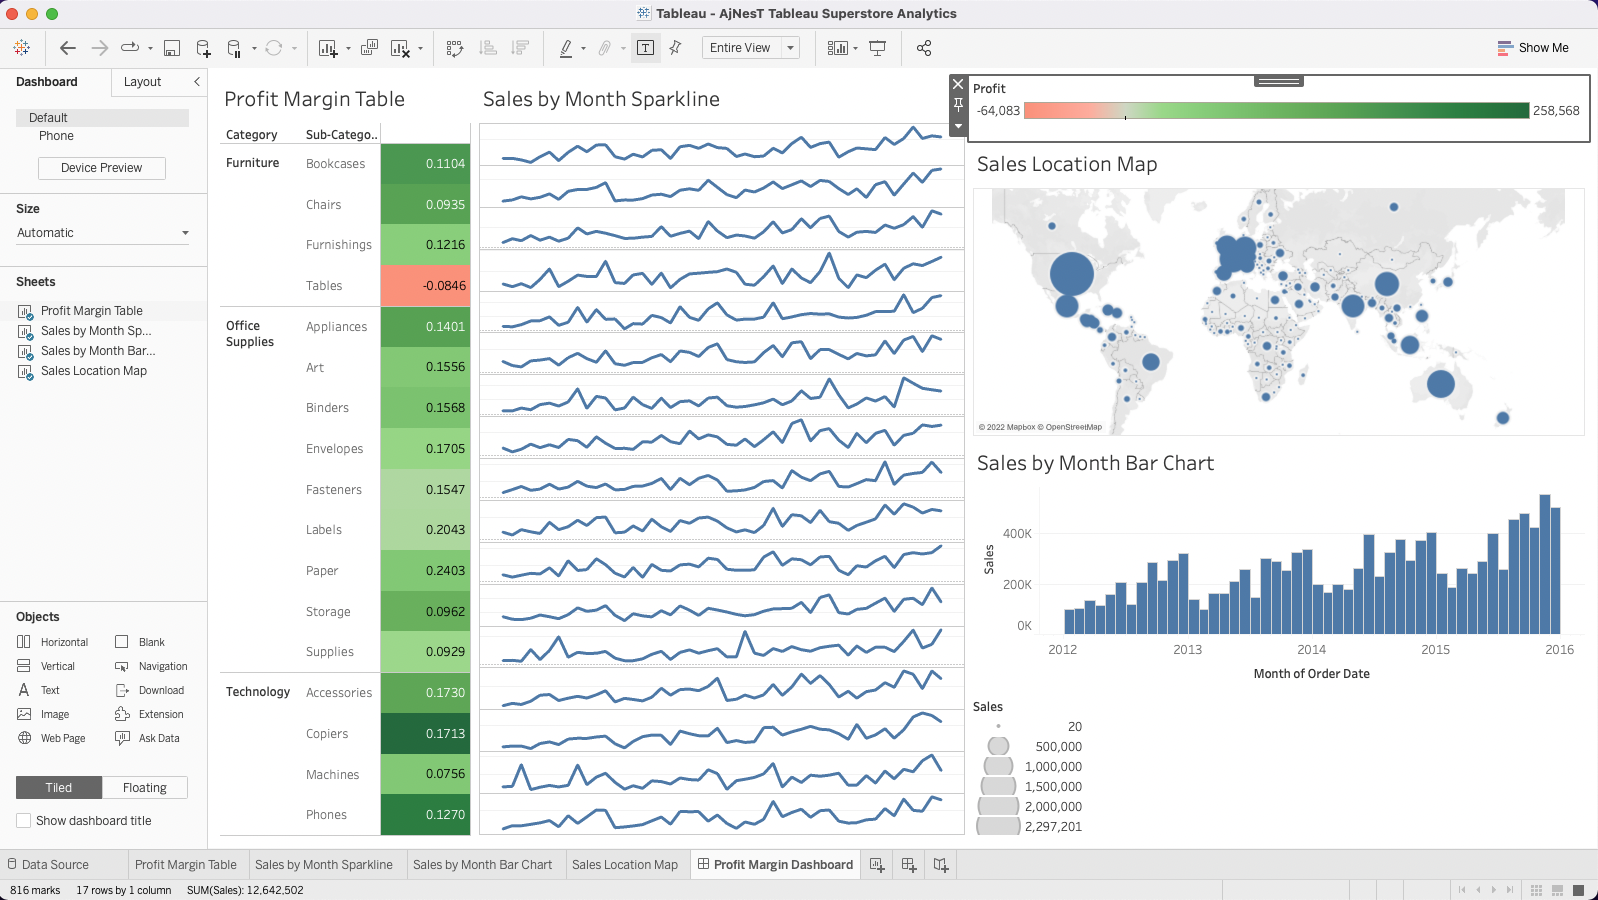
26. เลือก Use as Filter เพื่อให้สามารถ Filter ได้หลายรูปแบบ
27. ทำการเลือก Filter ของแต่ละคน –> สามารถกด แสดงสลับไปมาได้
28. ลองเลือกไปมาระหว่างกัน –> Show dashboard title –> แสดง Net Profit Margin Trends for Data Visualization